1. How to use this playbook
This playbook explains the standard reporting package made available to NHS practice reporting users. It is intended to help users understand what has been provided, what each report or dashboard is showing, and the key considerations to be aware of when reviewing the data.
The document is written for practice-level users responsible for reporting at an individual practice. It does not cover centralised reporting, central NHS submission processes, or detailed report scheduling configuration.
1.1 What this playbook covers
- The two live wallboards that make up the Live Dashboard.
- The Full Call Details (Today) report.
- The standard historic report bundles and the reports included within them.
- Plain-English explanations of the main report fields.
- Important usage notes, limitations and considerations.
1.2 What this playbook does not cover
- How to build new reports from scratch.
- Report scheduling.
- Troubleshooting steps for suspected data issues.
- Centralised reporting processes managed outside the practice-level reporting pack.
Recommended approach
Use the standard reports as the trusted baseline for practice reporting. Users can copy reports and create their own views if they want to explore further, but the base/default reports should not be changed. This helps keep local reporting aligned to the centralised reporting model.
2. Quick reference
The reporting package is split into three main areas: live visibility, today call details, and historic reporting.
|
Area |
What it is for |
How to use it |
|
Live Dashboard |
Real-time view of today’s queue and callback position. |
Use when you want to understand what is happening now, including callers waiting, longest waiting caller, currently answered calls and current callback position. |
|
Full Call Details (Today) |
Detailed call log for calls from today. |
Use when you need to review individual calls. If the report has been open for a while, click rerun/refresh to bring it up to date. |
|
Historic report bundles |
Standard historic views by day of week or by hour. |
Use to review previous performance across the defined timeframe, for example this week, last week, this month, last month, or yesterday by hour. |
2.1 Key reminders
- The Live Dashboard is real-time and shows today only, from midnight to the current moment.
- Full Call Details (Today) is a historical report using today as the timeframe. It does not automatically refresh while open.
- Historic reports use the timeframe shown in the folder/report name.
- Weekly reports start on Monday.
- Monthly reports use calendar months.
- Each practice is provided with reports filtered to its own site/practice data.
- The standard reports should be left unchanged. Copy a report first if you want to create a local variation.
Refresh behaviour
If Full Call Details (Today) has been open for a while, click the rerun/refresh button (see screenshot below) to update the report with the latest available calls. This is expected behaviour and does not indicate a problem with the report.
![]()
3. Reporting package overview
Each practice receives a standard reporting package. The package is designed to give practice users access to consistent local reporting that aligns with the centralised reporting model. The reports are filtered to the relevant practice/site by default.
3.1 Report inventory
|
Folder / area |
Report or wallboard |
Timeframe |
Purpose |
|
Live Dashboard |
Queue Stats |
Today, real-time |
Shows current queue position and today’s inbound call handling metrics. |
|
Live Dashboard |
Call Back Stats |
Today, real-time |
Shows current callback requests, outstanding callbacks, attempted callbacks and callback outcomes. |
|
Full Call Details (Today) |
Current day reporting |
Today |
Detailed call log for today. Requires manual rerun/refresh if left open. |
|
Historic – Last Month [By Day Of Week] |
Full Call Details |
Last calendar month |
Detailed call log for the selected historic timeframe. |
|
Historic – Last Month [By Day Of Week] |
Answered / Abandoned / Callback Last Month |
Last calendar month by day of week |
Shows answered, abandoned and callback metrics by day. |
|
Historic – Last Month [By Day Of Week] |
Ended During IVR Stage Last Month |
Last calendar month by day |
Shows calls ended while in the IVR/Auto Attendant stage. |
|
Historic – Last Month [By Day Of Week] |
Answered Calls – Wait Time Last Month |
Last calendar month by day of week |
Shows answered calls by wait-time band. |
|
Historic – Last Month [By Day Of Week] |
Missed Calls – Wait Time Last Month |
Last calendar month by day of week |
Shows missed/abandoned calls by wait-time band. |
|
Historic – Last Week [By Day Of Week] |
Same five reports as Last Month bundle |
Previous Monday to Sunday by day of week |
Same report structure, using last week as the timeframe. |
|
Historic – This Month [By Day Of Week] |
Same five reports as Last Month bundle |
Current calendar month to date by day of week |
Same report structure, using this month as the timeframe. |
|
Historic – This Week [By Day Of Week] |
Same five reports as Last Month bundle |
Current week from Monday to date by day of week |
Same report structure, using this week as the timeframe. |
|
Historic – Yesterday [By Hour] |
Same five reports as historic bundles |
Yesterday by hour |
Same report structure, but grouped by hour rather than by day. |
Naming note
Where possible, this playbook uses the exact report/folder names shown in the platform.
4. Live Dashboard
The Live Dashboard is made up of two wallboards: Queue Stats and Call Back Stats. It is intended to give users a real-time view of what is happening today.

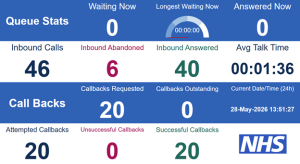
4.1 Queue Stats wallboard
The Queue Stats wallboard shows the current queue position and today’s inbound call activity. The live/state-based fields show what is happening now. The daily volume fields show activity from midnight to the current moment.
|
Field |
What it shows |
|
Waiting now |
The number of callers currently waiting in the queue. |
|
Longest Waiting now |
The length of time the longest-waiting caller has currently been waiting in the queue. |
|
Answered Now |
The number of calls that have been answered and are currently connected to a user. |
|
Inbound Calls |
Total inbound calls for today, from midnight to the current moment. |
|
Inbound Abandoned |
Inbound calls abandoned by the caller today, from midnight to the current moment. |
|
Inbound answered |
Inbound calls answered today, from midnight to the current moment. |
|
Average talk time |
Average talk time for answered calls today. |
4.2 Call Back Stats wallboard
The Call Back Stats wallboard shows callback activity for today. Callback metrics are based on callbacks requested and processed during the daily reporting window.
|
Field |
What it shows |
|
Call Backs Requested |
The number of callbacks requested by callers today. A callback is requested when an eligible caller in the queue selects the callback option. |
|
Callbacks outstanding |
Callbacks that have been requested but have not yet been actioned. |
|
Attempted Callbacks |
Callbacks that have been attempted. |
|
Unsuccessful Callbacks |
Callback attempts that did not connect to the user. |
|
Successful Callbacks |
Callback attempts where the call connected to the user. |
4.3 Live Dashboard usage notes
- The wallboards are real-time and do not require manual refresh during normal use.
- The dashboard shows today only, from midnight to the current moment.
- Practices can choose how to use the dashboard. It can be displayed on a wallboard screen or kept open on a user’s PC for review.
- A running wallboard does not time the user out while it remains open.
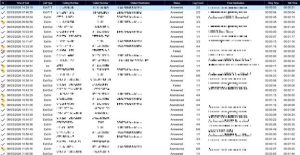
5. Full Call Details (Today)
Full Call Details (Today) is a detailed call log for calls from today. Although the timeframe is today, this is treated as a historical report rather than a real-time wallboard.

Refresh behaviour
If Full Call Details (Today) has been open for a while, click the rerun/refresh button (see screenshot below) to update the report with the latest available calls. This is expected behaviour and does not indicate a problem with the report.
5.1 Fields included
|
Field |
What it shows |
|
Call Outcome Status Icon |
A visual indicator of the call outcome/status. |
|
Time of call |
The time the call occurred. |
|
Call type |
The type or direction/category of the call: Ext/In = External, inbound Ext/Out = External, outbound |
|
Calling number |
The number that made the call. |
|
Called number |
The number that was called. |
|
Dialled Destination |
The destination dialled or routed to. |
|
Status |
The reported status/outcome of the call. |
|
Leg Count |
The number of segments in the call journey. For example, a call may move from IVR to queue to agent, creating multiple legs. |
|
Device Ended at |
The final device/user the call was connected to. |
|
Ring time |
The amount of time the call spent ringing. |
|
Talk time |
The amount of time spent connected in conversation. |
5.2 Exporting and scheduling
Users can view reports in-platform and may also have options to export manually, including Excel, CSV, PDF or RTF. Report scheduling can also be configured separately.
6. Historic report bundles
The historic report bundles provide standard views across defined timeframes. The report structure is intentionally consistent across the bundles, so users can compare the same measures using different time windows.
6.1 Historic folder structure
|
Folder |
Grouping |
Timeframe |
|
Historic – Last Month [By Day Of Week] |
By day of week |
Previous calendar month. |
|
Historic – Last Week [By Day Of Week] |
By day of week |
Previous Monday to Sunday. |
|
Historic – This Month [By Day Of Week] |
By day of week |
Current calendar month to date. |
|
Historic – This Week [By Day Of Week] |
By day of week |
Current week from Monday to date. |
|
Historic – Yesterday [By Hour] |
By hour |
Yesterday, grouped by hour. |
Timeframe note
Weekly reports use Monday as the start of the week. Monthly reports use calendar months. All sites are in the UK timezone.
6.2 Reports included in each historic bundle
Each historic bundle contains the same core reports. The end of the report name changes to reflect the selected timeframe, for example Last Month, Last Week, This Month, This Week or Yesterday.
6.2.1 Full Call Details
This report provides a detailed call log for the selected historic timeframe. It uses the same general structure and fields as Full Call Details (Today).
- For closed timeframes such as Last Week or Last Month, rerunning the report should not materially change the result because the reporting window is closed.
- For current timeframes such as This Week or This Month, rerunning the report updates the results to the latest point in the active reporting window.
6.2.2 Answered / Abandoned / Callback [Timeframe]
This report summarises inbound handling and callback activity for the selected timeframe, grouped by day of week or by hour depending on the bundle.
|
Field |
What it shows |
|
Day of week / Hour |
The reporting group used by the selected bundle. Yesterday is grouped by hour; the other historic bundles are grouped by day. |
|
In |
Inbound call volume for the row. |
|
Answered |
Answered inbound calls for the row. |
|
Answered % |
Answered calls as a percentage of the relevant row total. |
|
Abandoned |
Abandoned inbound calls for the row. |
|
Abandoned % |
Abandoned calls as a percentage of the relevant row total. |
|
Callback Requested |
Callbacks requested during the row timeframe. |
|
Callbacks Attempted |
Callback attempts during the row timeframe. |
|
Callbacks Successful |
Callback attempts that connected to the user. |
|
Callbacks Unsuccessful |
Callback attempts that did not connect to the user. |
Known consideration
This report does not include scenarios where a call is lost before reaching the queue, such as calls ended in the IVR/Auto Attendant.
6.2.3 Ended During IVR Stage [Timeframe]
This report shows calls that ended while in the IVR/Auto Attendant stage. These are calls ended before reaching the queue and should not be interpreted as agents missing calls.
|
Field |
What it shows |
|
Day / Hour |
The timeframe being reported against. |
|
Endpoint Description |
Description of the endpoint associated with the call. |
|
Device (DDI) |
The device or DDI associated with the call route. |
|
Ended During IVR Stage Total |
Total calls ended during the IVR/Auto Attendant stage. |
|
% Ended in AA (Auto attendant) |
Percentage of relevant Auto Attendant/IVR calls that ended during that stage. |
6.2.4 Answered Calls – Wait Time [Timeframe]
This report looks only at answered calls. It shows how many answered calls fell into each wait-time band and what percentage each band represents.
|
Field |
What it shows |
|
Day of Week / Hour |
The timeframe being reported against. |
|
Answered |
Total answered calls for the row. |
|
Less than a minute |
Number of answered calls with wait time under one minute. |
|
Less than a minute % |
Percentage of answered calls in this wait-time band. |
|
1-2 Minutes |
Number of answered calls with wait time between one and two minutes. |
|
1-2 Minutes % |
Percentage of answered calls in this wait-time band. |
|
2-5 minutes |
Number of answered calls with wait time between two and five minutes. |
|
2-5 minutes % |
Percentage of answered calls in this wait-time band. |
|
Longer than 5 minutes |
Number of answered calls with wait time longer than five minutes. |
|
Longer than 5 minutes % |
Percentage of answered calls in this wait-time band. |
Percentage note
Percentages are calculated against answered calls for the row, not against all calls into the system.
6.2.5 Missed Calls – Wait Time [Timeframe]
This report uses the same wait-time banding as Answered Calls – Wait Time, but focuses on missed/abandoned calls. It shows how long callers waited before the call was abandoned.
|
Field |
What it shows |
|
Day of Week / Hour |
The timeframe being reported against. |
|
Abandoned |
Total abandoned calls for the row. |
|
Less than a minute |
Number of abandoned calls with wait time under one minute. |
|
Less than a minute % |
Percentage of abandoned calls in this wait-time band. |
|
1-2 Minutes |
Number of abandoned calls with wait time between one and two minutes. |
|
1-2 Minutes % |
Percentage of abandoned calls in this wait-time band. |
|
2-5 minutes |
Number of abandoned calls with wait time between two and five minutes. |
|
2-5 minutes % |
Percentage of abandoned calls in this wait-time band. |
|
Longer than 5 minutes |
Number of abandoned calls with wait time longer than five minutes. |
|
Longer than 5 minutes % |
Percentage of abandoned calls in this wait-time band. |
Percentage note
Percentages are calculated against abandoned calls for the row, not against all calls into the system.
7. Report field glossary
This glossary explains the main fields used across the reporting package. Some fields appear in multiple reports.
|
Field |
Plain-English explanation |
|
AA |
Auto Attendant. In this reporting context, AA refers to the IVR/Auto Attendant stage. |
|
Abandoned |
An unanswered inbound call abandoned by the caller, with no subsequent call segments after the abandonment point. |
|
Abandoned % |
Abandoned calls as a percentage of the relevant row total. |
|
Answered |
Inbound calls answered during the corresponding reporting interval. |
|
Answered % |
Answered calls as a percentage of the relevant row total. |
|
Answered Now |
Calls currently connected to a user. |
|
Average talk time |
Average duration of connected conversation for answered calls. |
|
Callback Requested |
A callback selected/requested by an eligible caller while waiting in the queue. |
|
Callbacks Attempted |
Callbacks that have been attempted. |
|
Callbacks outstanding |
Callbacks requested but not yet actioned. |
|
Callbacks Successful |
Callback attempts that connected to the user. |
|
Callbacks Unsuccessful |
Callback attempts that did not connect to the user. |
|
Call Outcome Status Icon |
A visual indicator of the call outcome/status. |
|
Call type |
The call direction or category shown by the report. |
|
Called number |
The number that was called. |
|
Calling number |
The number that made the call. |
|
Day / Day of Week |
The day grouping used by the report. |
|
Device (DDI) |
The device or DDI associated with the call route. |
|
Device Ended at |
The final device/user the call was connected to. |
|
Dialled Destination |
The destination dialled or routed to. |
|
Endpoint Description |
Description of the endpoint associated with the call. |
|
Ended During IVR Stage Total |
Total calls ended during the IVR/Auto Attendant stage. |
|
In |
Inbound call volume for the relevant row. |
|
Inbound answered |
Inbound calls answered during the reporting window. |
|
Inbound Abandoned |
Inbound calls abandoned during the reporting window. |
|
Inbound Calls |
Total inbound calls during the reporting window. |
|
Leg Count |
The number of segments in the call journey. |
|
Longest Waiting now |
The wait time of the caller who has currently been waiting longest in the queue. |
|
Ring time |
Time spent ringing. |
|
Status |
The reported status/outcome of the call. |
|
Talk time |
Time spent connected in conversation. |
|
Waiting now |
The number of callers currently waiting in the queue. |
8. Usage guidance and good practice
8.1 Use the standard reports as the baseline
The standard reporting package has been created to give each practice a consistent reporting baseline aligned to the centralised reporting model. Users should avoid changing the provided base/default reports.
- Use the standard reports for consistent practice-level review.
- Copy a report before experimenting or creating a local variation.
- Avoid changing filters, devices or report logic in the base/default reports.
- Keep local copies clearly named so they are not confused with the standard reports.
8.2 Understand the difference between live and historical reporting
|
Report type |
Refresh behaviour |
Best used for |
|
Live Dashboard |
Real-time; no manual refresh required during normal use. |
Current operational position today. |
|
Full Call Details (Today) |
Manual rerun/refresh required if left open. |
Reviewing individual calls from today. |
|
Historic reports – closed timeframes |
Rerun available, but the reporting window is closed. |
Reviewing completed periods such as Last Week or Last Month. |
|
Historic reports – active timeframes |
Rerun updates the report to the latest point in the active period. |
Reviewing current week or current month to date. |
9.1 Standard reports should not be modified
The standard reports depend on the correct filters, devices and report configuration. Although users may have the ability to edit reports, they should not change the provided base/default reports. If a local variation is needed, copy the report first and edit the copy.
9.2 Callback reporting
- Callbacks are reported within the daily reporting window.
- Callbacks requested today are not expected to carry into the next day’s reporting view.
- Successful callbacks are understood as callbacks that connect to the user.
- Unsuccessful callbacks are understood as callback attempts that do not connect to the user.
9.3 IVR/Auto Attendant calls
Calls ended during the IVR/Auto Attendant stage are reported separately in the Ended During IVR Stage reports. These calls should be understood as calls that ended before reaching the queue; they should not be interpreted as calls missed by agents.
9.4 Answered / abandoned / callback report limitation
There is a known limitation in the Answered / Abandoned / Callback report where calls lost in the IVR/Auto Attendant are not included in the same way as queue-level answered or abandoned calls.